Inicio/Smart Production

Smart Production

Q4 2025Demo en vivo

Para Bayer Cropscience

Un planificador de Bayer Cropscience rearmaba a mano el cronograma de producción cada vez que la demanda se movía. Ahora arrastra una barra en un Gantt, ve qué se rompe y confirma. Un día de recálculo se convirtió en veinte minutos.
Smart ProductionSmart Production
AntesDespués
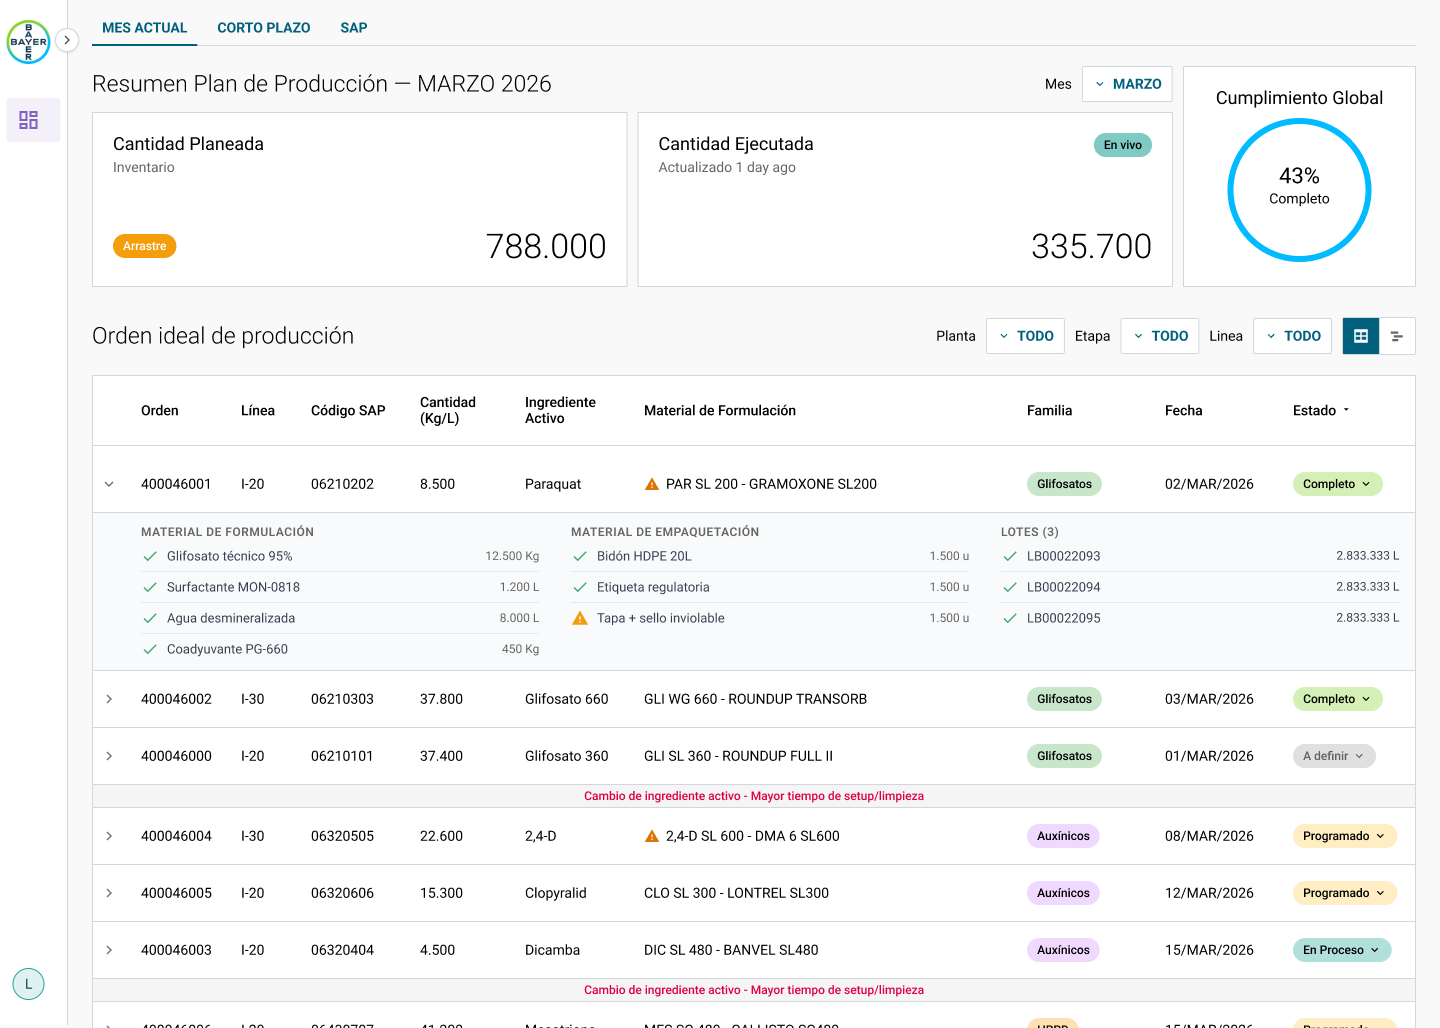
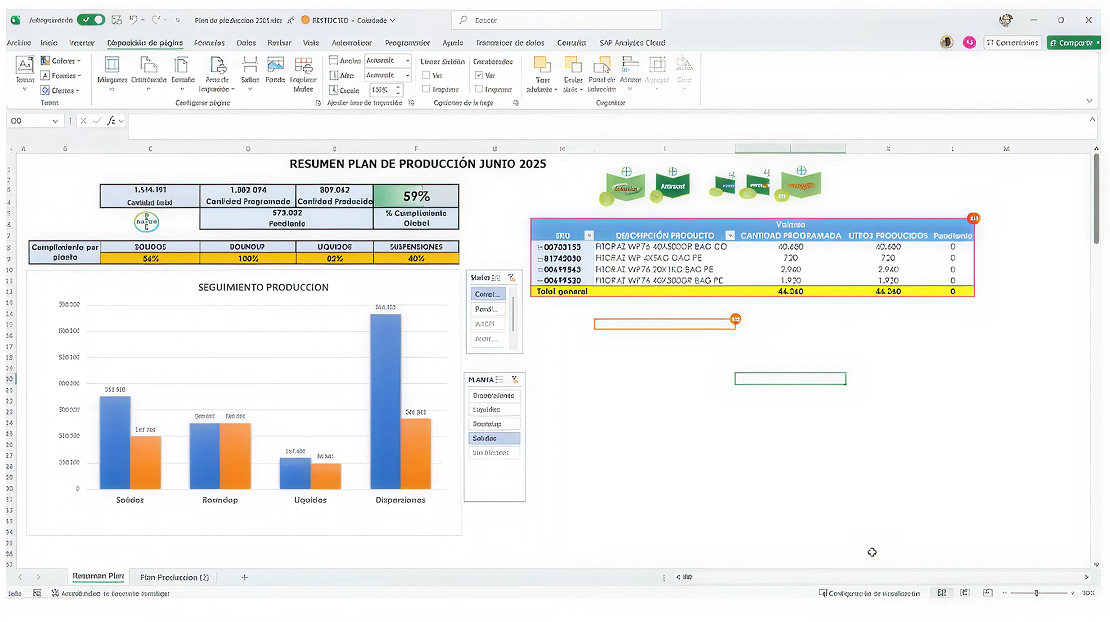
El resumen del plan de junio 2025, una de las tres planillas que un planificador tenía abiertas. Después: la misma línea de producción en Smart Production.Arrastrá para comparar

La planificación vivía en tres libros. Programación Planta listaba cada material por línea con un estado pintado a mano: Cumplido, En Proceso, Programado. Resumen Plan juntaba totales en un gráfico de barras y un solo número, 59% de cumplimiento global. Y un plan preliminar del mes siguiente, 120 filas, con cantidades pegadas desde consultas a SAP. SAP tenía la verdad sobre materiales y órdenes; Excel tenía el plan; el planificador era la capa de integración entre los dos.

Programación Planta, con el estado pintado celda por celda, y Plan preliminar Julio: una fila por material, una columna por semana, totales a mano. Un cambio chico de demanda implicaba tocar casi todo.

Nadie podía ver la línea. Se veían cantidades y colores, pero no el tiempo: qué orden corre cuándo, qué bloquea, qué empuja una demora. Así que cada pregunta de la planta se convertía en un llamado a planificación, y cada respuesta implicaba volver a correr las consultas y rearmar la planilla.


La decisión que le dio forma a la herramienta fue tratar el cronograma como una simulación primero y un plan después. Cada arrastre, división o reorden pasa sobre un borrador. El Gantt recalcula los materiales requeridos y marca faltantes al instante, pero nada se escribe hasta que el planificador confirma. Un planificador solo habría pedido una planilla más rápida. Un ingeniero solo habría escrito el cambio directo. La capa de borrador es lo que hizo que la gente confiara.

Moviendo una orden: los materiales afectados y la cobertura de demanda se actualizan mientras arrastrás.

Lo diseñé y construí como prototipo funcional en código en vez de un deck de Figma, conectado a los mismos códigos de material que usaban las planillas. Los planificadores lo probaron con sus propios escenarios la primera semana. De ahí salieron las marcas de faltantes y la vista de revisar antes de confirmar; ninguna estaba en la lista original.

Revisando un cambio antes de confirmarlo.
1 day →20 minRearmar el plan tras un cambio de demanda
3 →1Herramientas que usa un planificador (SAP, Excel, mail)
0 →AnyEscenarios simulados antes de confirmar
Every one →0Recálculos manuales por ajuste

Qué haría distinto: sumar a alguien de materiales la primera semana. La lógica de materiales fue lo que más iteré, y la mitad de esas iteraciones eran cosas que un planificador ya sabía.

Exelobaiza | Design Engineer

ENES
███████╗██╗  ██╗███████╗██╗      ██████╗ ██████╗  █████╗ ██╗███████╗ █████╗
██╔════╝╚██╗██╔╝██╔════╝██║     ██╔═══██╗██╔══██╗██╔══██╗██║╚══███╔╝██╔══██╗
█████╗   ╚███╔╝ █████╗  ██║     ██║   ██║██████╔╝███████║██║  ███╔╝ ███████║
██╔══╝   ██╔██╗ ██╔══╝  ██║     ██║   ██║██╔══██╗██╔══██║██║ ███╔╝  ██╔══██║
███████╗██╔╝ ██╗███████╗███████╗╚██████╔╝██████╔╝██║  ██║██║███████╗██║  ██║
╚══════╝╚═╝  ╚═╝╚══════╝╚══════╝ ╚═════╝ ╚═════╝ ╚═╝  ╚═╝╚═╝╚══════╝╚═╝  ╚═╝
# Smart Production ## Bayer Cropscience — Q4 2025 --- [Live demo](https://smart-production-demo.vercel.app/) Context: Production planning at Bayer Cropscience lived in an **Excel spreadsheet fed by SAP queries**: no visual way to see the production line, and every adjustment meant recalculating by hand. My role: We turned that workflow into a **visual production planner**: an interactive **Gantt chart** where planners can consult and modify the production line based on **required materials and current demand**, simulating changes before committing them. Impact: Planning moved from spreadsheets and SAP lookups into **one visual system**, so the ideal production schedule can be reviewed and adjusted in minutes instead of rebuilt by hand. A planner at Bayer Cropscience rebuilt the production schedule by hand every time demand moved. Now they drag a bar on a Gantt, see what breaks, and confirm. **A day of recalculating became twenty minutes.** Before: ![The monthly plan summary in Excel](https://res.cloudinary.com/dcy607q9x/image/upload/portfolio/bayer/before-02-resumen-plan.png) After: ![The same plan as an interactive Gantt](https://res.cloudinary.com/dcy607q9x/image/upload/v1786445161/Bay1_mawwhr.png) Planning lived in three workbooks. **Programación Planta** listed every material per line with a hand-colored status: Cumplido, En Proceso, Programado. **Resumen Plan** pulled totals into a bar chart and a single number, 59% global compliance. And a preliminary plan for the next month, 120 rows deep, with quantities pasted from SAP queries. SAP had the truth about materials and orders; Excel had the plan; the planner was the integration layer between them. ![Programación Planta, with status colored cell by cell, and Plan preliminar Julio: one row per material, one column per week, totals by hand. A small demand change meant touching most of it.](https://res.cloudinary.com/dcy607q9x/image/upload/portfolio/bayer/before-01-programacion-planta.png) ![Programación Planta, with status colored cell by cell, and Plan preliminar Julio: one row per material, one column per week, totals by hand. A small demand change meant touching most of it.](https://res.cloudinary.com/dcy607q9x/image/upload/portfolio/bayer/before-03-plan-preliminar.png) Nobody could see the line. You could see quantities and colors, but not time: which order runs when, what it blocks, what a delay pushes. So every question from the plant became a phone call to planning, and every answer meant re-running the queries and rebuilding the sheet. --- The decision that shaped the tool was to treat the schedule as **a simulation first and a plan second**. Every drag, split or reorder happens on a draft. The Gantt recomputes required materials and flags shortages immediately, but nothing is written until the planner confirms. A planner alone would have asked for a faster spreadsheet. An engineer alone would have written the change straight through. The draft layer is what made people trust it. ![Moving an order: the affected materials and the demand coverage update while you drag.](https://res.cloudinary.com/dcy607q9x/image/upload/v1786445161/Bay2_k6plh1.png) I designed and built it as a working prototype in code rather than a Figma deck, wired to the same material codes the spreadsheets used. Planners tested it on their own scenarios in the first week. That is where the shortage flags and the review-before-commit view came from; neither was on the original list. ![Reviewing a change before committing it.](https://res.cloudinary.com/dcy607q9x/image/upload/v1786445162/Bay3_d5xqyi.png) - Rebuilding the plan after a demand change: 1 day → 20 min - Tools a planner works in (SAP, Excel, email): 3 → 1 - Scenarios simulated before committing: 0 → Any - Manual recalculations per adjustment: Every one → 0 What I'd do differently: bring a materials expert into the first week. The materials logic was the part I iterated on most, and half of those iterations were things a planner already knew. --- All case studies: [https://www.exelobaiza.dev/work](https://www.exelobaiza.dev/work) (markdown mirror: [work.md](https://www.exelobaiza.dev/work.md)) ## Contact - LinkedIn: https://www.linkedin.com/in/exequiel-lobaiza/ - GitHub: https://github.com/exelobaiza