By Bayer Cropscience
A planner at Bayer Cropscience rebuilt the production schedule by hand every time demand moved. Now they drag a bar on a Gantt, see what breaks, and confirm. A day of recalculating became twenty minutes.
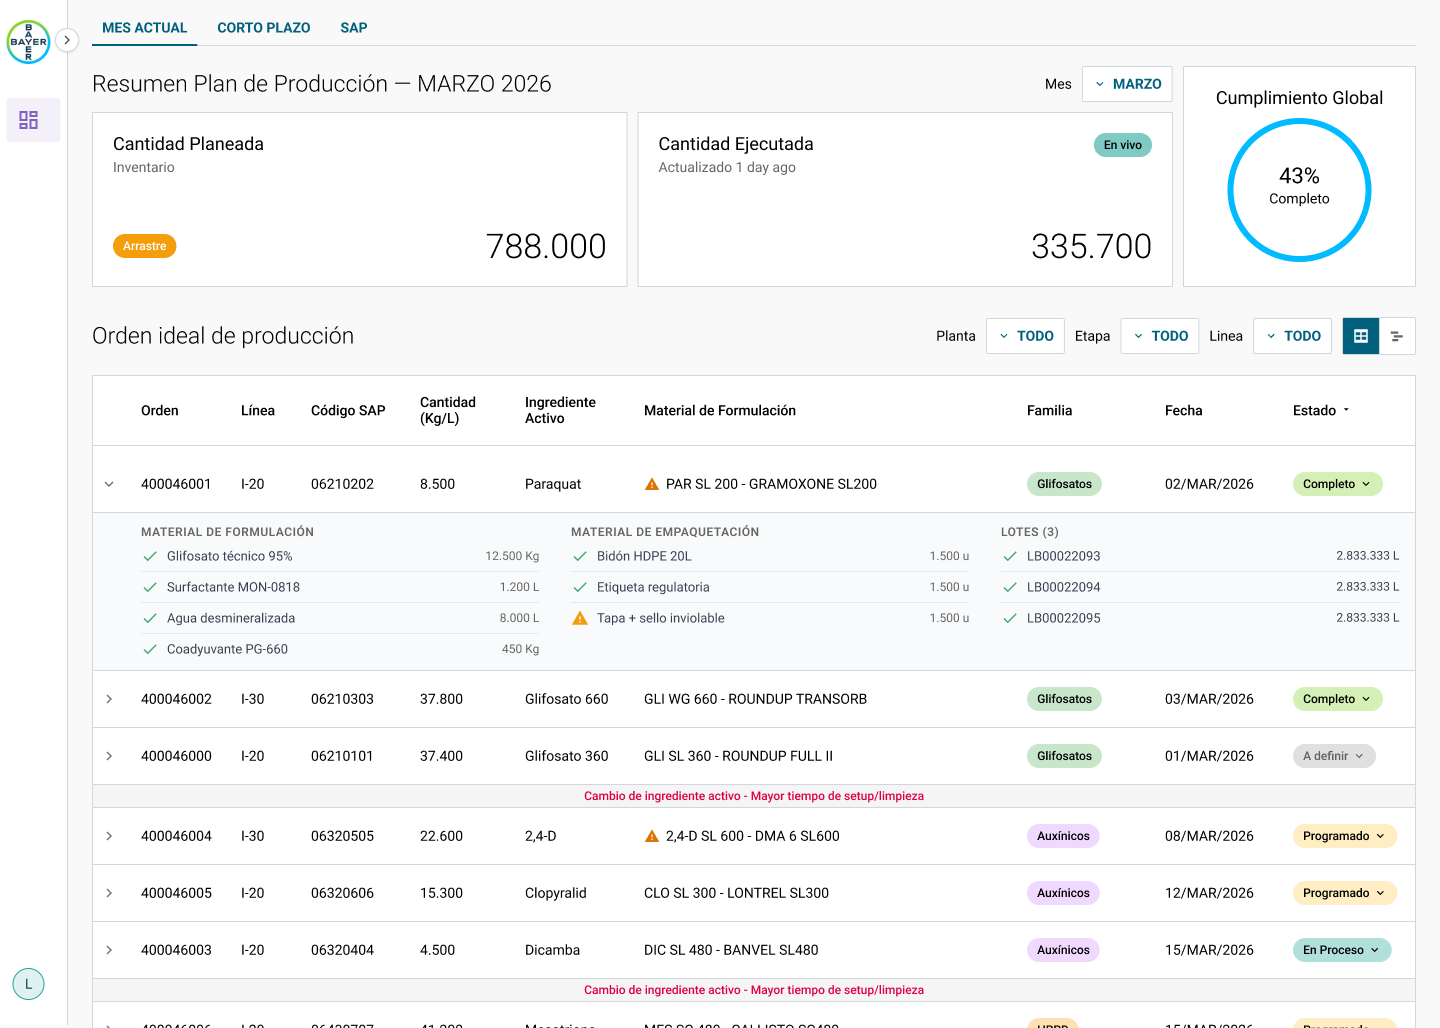
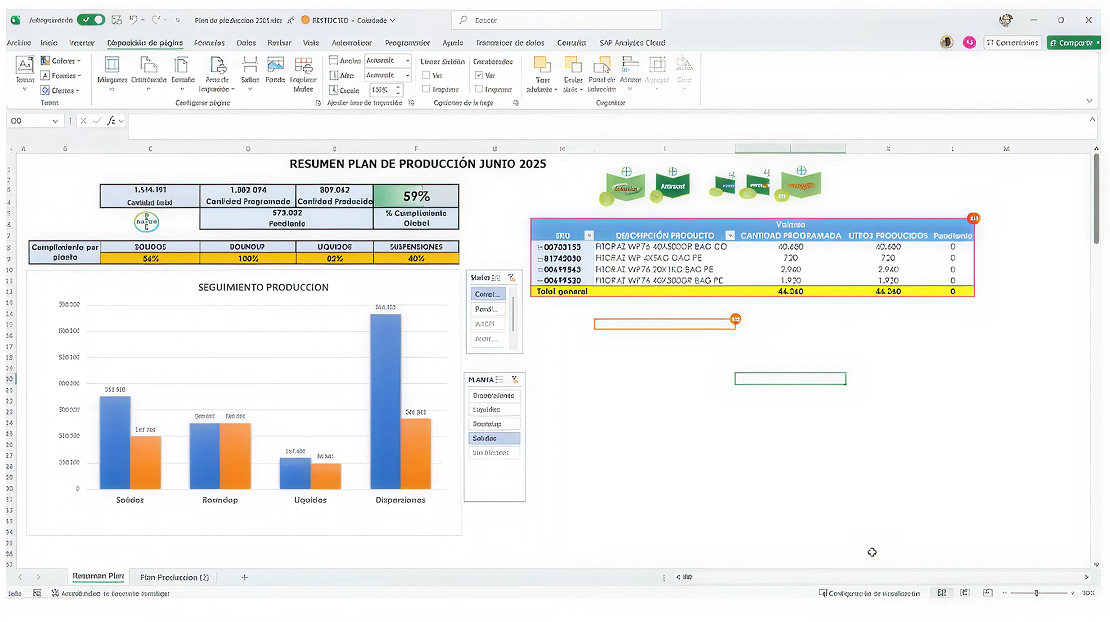
BeforeAfter
Planning lived in three workbooks. Programación Planta listed every material per line with a hand-colored status: Cumplido, En Proceso, Programado. Resumen Plan pulled totals into a bar chart and a single number, 59% global compliance. And a preliminary plan for the next month, 120 rows deep, with quantities pasted from SAP queries. SAP had the truth about materials and orders; Excel had the plan; the planner was the integration layer between them.
Nobody could see the line. You could see quantities and colors, but not time: which order runs when, what it blocks, what a delay pushes. So every question from the plant became a phone call to planning, and every answer meant re-running the queries and rebuilding the sheet.
The decision that shaped the tool was to treat the schedule as a simulation first and a plan second. Every drag, split or reorder happens on a draft. The Gantt recomputes required materials and flags shortages immediately, but nothing is written until the planner confirms. A planner alone would have asked for a faster spreadsheet. An engineer alone would have written the change straight through. The draft layer is what made people trust it.
I designed and built it as a working prototype in code rather than a Figma deck, wired to the same material codes the spreadsheets used. Planners tested it on their own scenarios in the first week. That is where the shortage flags and the review-before-commit view came from; neither was on the original list.
1 day →20 minRebuilding the plan after a demand change
3 →1Tools a planner works in (SAP, Excel, email)
0 →AnyScenarios simulated before committing
Every one →0Manual recalculations per adjustment
What I'd do differently: bring a materials expert into the first week. The materials logic was the part I iterated on most, and half of those iterations were things a planner already knew.
Exelobaiza | Design Engineer